Downloads
DOI:
https://doi.org/10.47982/cgc.10.741Published
Issue
Section
License
Copyright (c) 2026 Richard Green, Terrence McDonnell, Andrew Crosby

This work is licensed under a Creative Commons Attribution 4.0 International License.
Abstract
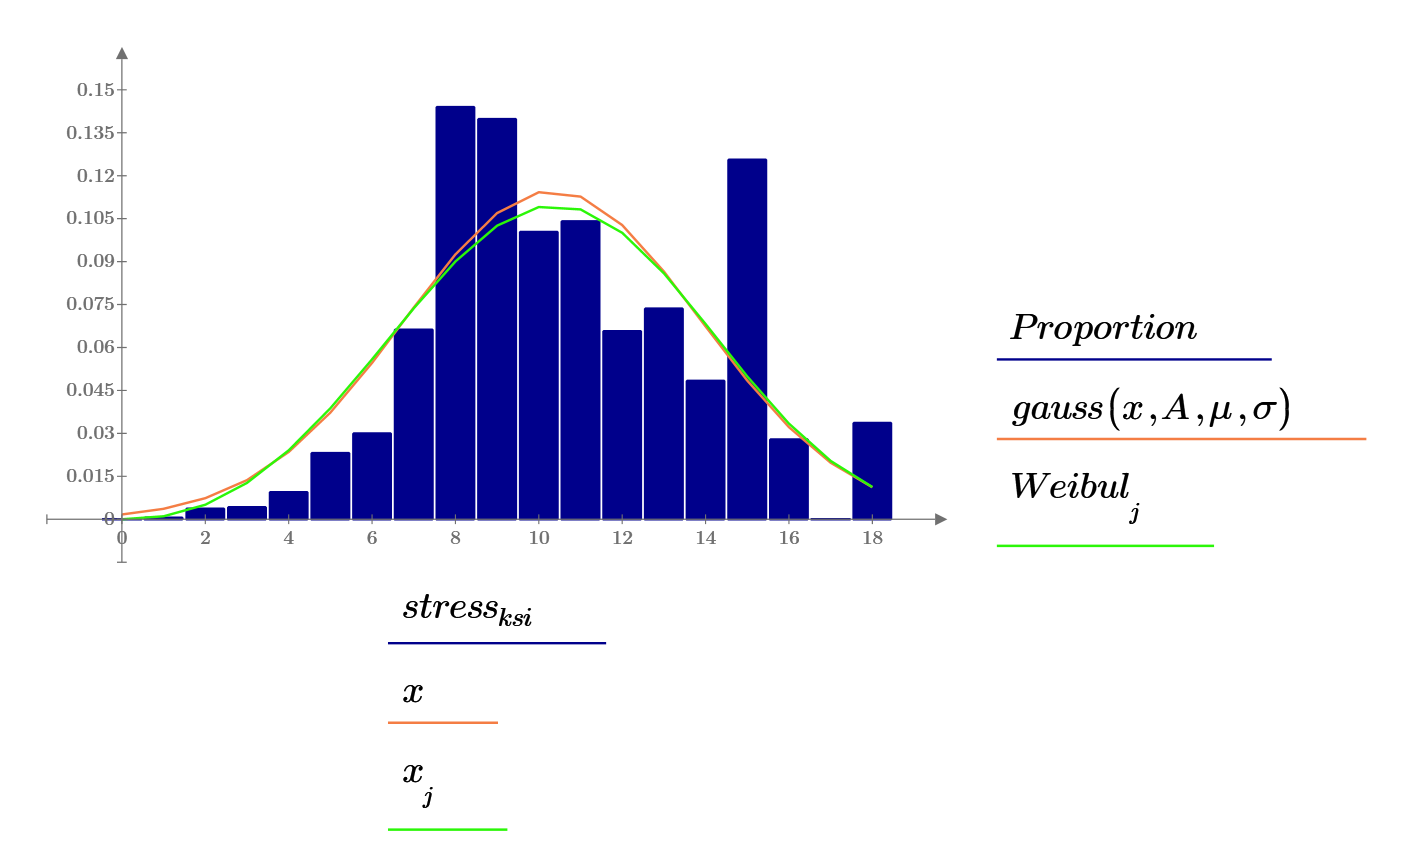
The design strength models in glass standards have evolved through a range of methodologies, each shaped by the assumptions and data sets available at the time. As there is no ideal model for all situations, new strength prediction models continue to evolve. This paper explores why stress probability integrals are useful for window glass and peak-stress based approaches are more suitable for structural applications, as well as why there is such a range of criteria published. (Can the mean modulus of rupture be 41 MPa (AAMA CW-19) if the 5% fractile characteristic strength is 45 MPa -- EN 16612, CEN/TS 19100, DIN 18008 etc. -- in the same material, and both be right?). Window glass is generally loaded out-of-plane and is thin relative to the target displacement. The resulting failure criterion is complex because the distribution of ‘stressed area’ to total area and biaxial vs uniaxial stress is a function of the load, aspect ratio and deflection to thickness ratio. The second order effects result in the system stiffening with increasing load and the 90% maximum stress profiles change in area and location with increasing load. The maximum stress often occurs on the surface of the panel. By contrast, structural glass applications are generally loaded in-plane, typically slender, with second order effects increasing stress as the combination of initial imperfections and load interact to generate secondary (minor axis) stresses which increase rapidly as the load approaches buckling. The maximum stress often occurs at the edge or connection point of the panel. Key considerations include Griffith flaws, Brown’s integral, flaw orientation, environmental effects such as weathering and self-healing, float glass characteristics, edge processing, and stress distribution patterns across system types. Statistical distributions examined include Normal (Gaussian), Weibull, and Lognormal. In selecting design strength criterion for the Structural Glass Design Manual, the approaches of ASTM E1300, CEN/TS 19100, AS1288 and AAMA CW-12 were examined and conclusions drawn for the merits and limitations of each approach considered relative to its intended purpose.